Frontier MechanicsField report / 114
Frontier Mechanics Week 114: A photonic gyro slows down, methane satellites take a blind test, TSMC prices the next node, and ICON scales the concrete printer
Rotation measured with circulating light, a ground-truth test for orbital sensing, the manufacturing economics inside TSMC's quarter, and the material science behind robotic construction. Reporting for October 12-18, 2026.
A sensor's most useful test is often the one where someone else knows the answer. This week brought a large blind evaluation of methane satellites, with controlled releases on the ground and independent estimates from the teams reading the orbital data. It is a more revealing exercise than collecting impressive pictures of plumes that were already known to exist.
There was also a photonic gyroscope sensitive to much slower rotation than its earlier integrated counterpart, a TSMC quarter that puts numbers on the cost of ramping a new process, and $200 million for ICON's construction robots. These are different kinds of progress. The gyro is a laboratory instrument moving toward integration; the methane study tests an existing observation system; TSMC is already manufacturing at enormous scale; ICON wants to turn a specialized construction process into a more widely deployed product. Treating all four as the same kind of breakthrough would miss what makes each worth examining.
Photonics / navigation
A photonic gyroscope measures slower rotation without a spinning mass
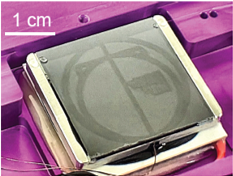
An October 14 Optics Letters result describes an integrated silicon-nitride Brillouin gyroscope measuring rotation as slow as 37 degrees per hour. The researchers compare that with 72,000 degrees per hour for their earlier silicon-nitride device, a nearly 2,000-fold improvement. The new sensing ring is about 24 millimeters across. This is an important result within that device lineage, not a claim to beat every optical gyroscope. Earth's rotation is about 15 degrees per hour, below the reported measurement level, and complete integration of the supporting components remains future work.
The basic mechanism is the Sagnac effect. Light traveling around a rotating loop in opposite directions accumulates a different propagation history. In a ring-laser arrangement, that difference can appear as a frequency separation between counterpropagating modes. For an idealized ring, the scale factor depends on enclosed area relative to perimeter and optical wavelength. Making the ring smaller is therefore not free. Integration wants a compact circuit; rotation sensitivity wants sufficient optical path geometry and a stable way to resolve a tiny difference between two much larger frequencies.
Brillouin scattering supplies the narrow-linewidth optical signals in this experiment. Light interacts with acoustic motion in the material, and a resonator can reinforce the resulting process. The reported ring has an intrinsic quality factor above 163 million. The researchers tested the packaged device on a piezoelectric rotation stage and compared its response with a separate optical interferometer. That independent reference is important: commanding a stage to move is not the same as knowing exactly how it moved. A measurement system should not validate itself against an unverified input command.
High optical quality means low loss and a long effective interaction with the circulating field. It also makes the system sensitive to disturbances that shift the resonance. Temperature, stress, pump behavior, and unwanted coupling can all matter in an optical sensor. A strong laboratory signal is the beginning of a calibration problem, not the end of one. The challenge is to preserve the rotation-dependent difference while rejecting other mechanisms that can move the measured frequencies. Two signals sharing a device can cancel common disturbances, but only to the extent that the disturbances act on them in the same way.
Navigation adds a harsh consequence to small errors: angular rate gets integrated. If a hypothetical gyro has a constant uncorrected bias of one degree per hour, its orientation estimate accumulates one degree of error after an hour. That is a simple illustration, not this device's measured bias. Random noise behaves differently from a steady offset, and both differ from temperature-dependent drift. A minimum detectable rotation in a controlled experiment does not specify all three. Buyers of navigation instruments need stability over time, calibration repeatability, and environmental performance, not just a sensitivity record.
This is why the 37-degrees-per-hour result should not be relabeled as a bias specification. The quantities answer different questions. A sensor can resolve a small changing signal while its baseline wanders over longer periods; another can have a stable baseline but a noisier short-term reading. Averaging helps some errors and exposes others. An evaluation should report how uncertainty changes with observation interval and how the instrument behaves after temperature cycling or restarting. Without that information, translating a laboratory rotation trace into a claim about GPS-denied navigation would be premature.
The packaging photograph is useful because it makes the integration boundary visible. A photonic circuit can be compact while the lasers, detectors, electronics, and connections around it remain substantial. Optical input power is not the complete electrical power budget. Likewise, compatibility with semiconductor fabrication is a route toward manufacturing, not evidence of high production yield. Coupling tolerances, wafer variation, and test time can determine cost even if the circuit uses a familiar process. These are solvable engineering problems, but they are separate from demonstrating the physical effect.
There is a good reason to pursue this route. A small optical gyro with no moving proof mass could serve applications where vibration, shock, or long-term orientation knowledge make simpler sensors inadequate. Whether this particular approach gets there will depend on the full noise and stability budget after integration. The next convincing result would keep the rotation reference independent while moving the supporting equipment into a realistic package. For now, the experiment has substantially reduced one barrier: the rotation signal no longer has to be enormous before this integrated architecture can see it.
Space / measurement science
Methane satellites take a blind test, including the empty scenes
A Nature study published October 14 evaluated satellite methane measurements against controlled releases in Arizona. The campaign included 481 releases and 265 no-release overpasses, with fifteen analysis teams across nine countries. On clear days, dedicated methane instruments detected 92-100 percent of the test plumes; repurposed instruments detected 62-88 percent. The release rates and blank cases gave the evaluators something rare in remote sensing: ground truth that the teams interpreting the images did not already know. The experiment ran during 2025; this week's event is publication of its results.
The blank cases are not a footnote. An algorithm that always reports a plume can achieve perfect detection of real plumes while being useless. Sensitivity must be read alongside false positives. In practice, the cost of a false alarm may be an inspection, an interrupted operation, or a loss of trust in the system. The cost of a missed release is different. There is no universal threshold that optimizes both without considering the decision the measurement will trigger. A good benchmark makes that tradeoff visible instead of hiding it inside a single score.
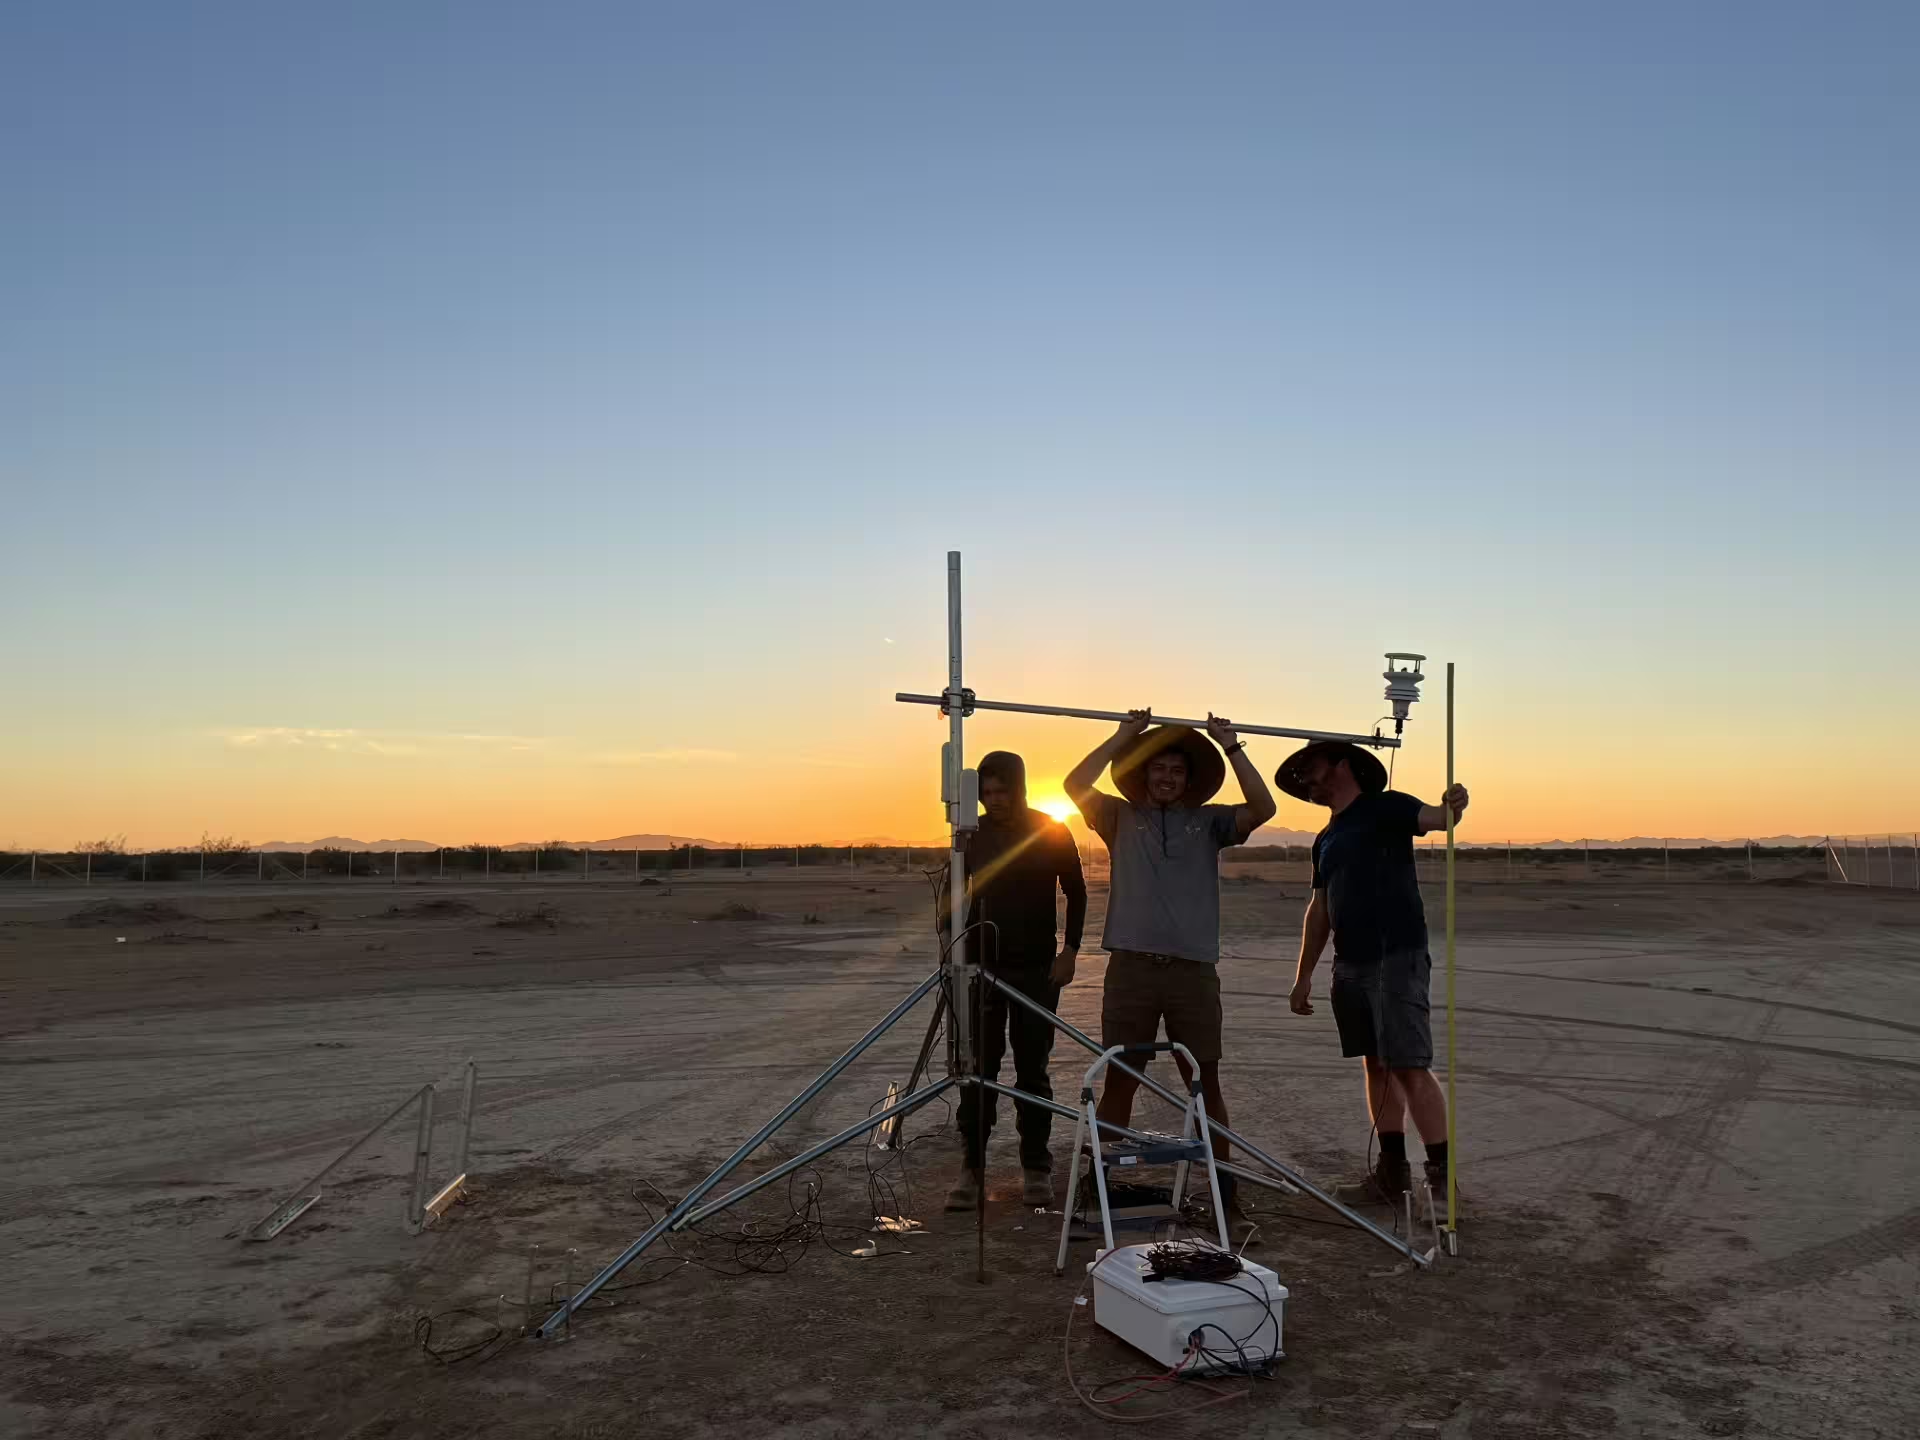
A satellite observes spectral information, not a meter reading from a pipe. Methane changes the reflected-light spectrum along the optical path. Processing estimates an enhancement above background, then uses spatial structure and atmospheric information to infer an emission rate. Wind is especially important because it transports and dilutes the gas. A large column enhancement in weak wind can imply a different source rate from a similar enhancement in strong wind. The photograph of the ground meteorology station belongs in this story because those unglamorous measurements help connect an orbital image to a physical flow.
Detection and quantification should remain separate. A system may correctly identify a leak while estimating its rate poorly. For dispatching a repair crew, that can still be useful. For calculating an emissions inventory or comparing two facilities with similar totals, the size and structure of the error matter much more. Errors that average out across many independent cases are different from a persistent bias. A single impressive match between predicted and actual flow says little about either. The study's repeated controlled events are valuable because they let those patterns emerge.
Stanford's account notes that individual estimates often differed from the true rate by as much as roughly 50 percent in either direction, while overestimates and underestimates tended to balance. It also identifies clear skies and favorable conditions as important limits. Those results do not imply continuous global coverage or equal performance over every surface. Desert terrain, clouds, vegetation, water, and viewing geometry change the observation problem. A benchmark can be both strong evidence in its tested regime and incomplete evidence elsewhere. That is a reason to extend it, not to pretend its successful cases never happened.
Base rates become important when a monitoring service scales. Consider a purely hypothetical set of 10,000 observations with real releases in 100. A detector with 95 percent sensitivity and a one-percent false-positive rate would find about 95 true events and flag about 99 empty scenes. Nearly half its alerts would be false despite specifications that sound excellent in isolation. This arithmetic is not a result from the paper. It explains why controlled blank observations and the prevalence of actual events must accompany a detection percentage when someone designs an operational response.
Another operational limit is time. A satellite may pass while an intermittent source is inactive, or miss a short release between usable observations. A high probability of detecting a plume when present in a clear image is not the same as a high probability of observing every release over a month. Combining instruments can improve opportunities, but their errors and weather limitations may be correlated. A monitoring plan needs to model when observations occur as well as what the algorithm can extract from each one. Coverage is a property of the observing system, not just the sensor.
This is one of the week's most useful studies because it subjects an attractive technology to an adversarially simple question: was gas actually being released, and how much? The answers support dedicated instruments while preserving substantial caveats about rate estimation and operating conditions. I would rather see that evidence than another gallery of dramatic plume images. A measurement service becomes more credible when it publishes the empty scenes, the misses, and the uncertainty that a customer must carry into the next decision.
Semiconductors / markets
TSMC's quarter shows why the next node can grow revenue and dilute margin
TSMC reported third-quarter results on October 15: $46.72 billion in revenue, up 41.2 percent year over year in US-dollar terms, and a 66.4 percent gross margin. Two-nanometer products represented 8 percent of wafer revenue; three-nanometer products represented 33 percent. The company guided fourth-quarter revenue to $52.3-54.3 billion. That last range is management's outlook, not booked revenue. The new-node share is a revenue measure, not the fraction of physical wafers or transistors produced. Those denominators matter before any interpretation of the quarter begins.
The interesting tension is that growth and margin pressure can arrive together. In the earnings call, management attributed a 1.3-percentage-point sequential gross-margin decline primarily to the two-nanometer ramp. A new process can attract valuable products while initially carrying a less favorable cost structure. Equipment, staffing, process learning, and qualification do not wait for every production variable to settle. A ramp is an interval during which the factory is both manufacturing and learning how to manufacture better. Strong demand can make that investment worthwhile without making its immediate cost disappear.
A simplified good-die calculation helps. If a hypothetical wafer costs 20,000 dollars to process and contains 500 gross die sites, an 80 percent usable yield gives 400 good dies at 50 dollars each before packaging and other costs. At 60 percent yield, the same wafer produces 300 good dies at about 66.67 dollars each. These are illustrative numbers, not TSMC's prices or yields. They show why process improvement can have substantial economic value even when the wafer starts, tool set, and nominal design remain unchanged.
Die area complicates the calculation further. Larger chips generally fit fewer times on a wafer and expose more area per chip to defects. Partitioning a design into chiplets can change that tradeoff, but introduces packaging, interconnect, test, and system-design costs. There is no universal rule that the newest node or the smallest chiplet wins. The appropriate architecture depends on which parts benefit from density and power improvements, which interfaces are expensive, and how yield behaves. A foundry's revenue mix is therefore the outcome of many customer-level design decisions, not merely a march from one node label to the next.
The earnings call reported high-performance computing at 68 percent of revenue, with that category growing 22 percent sequentially. HPC should not be casually relabeled as pure AI revenue. The category is broader, and a supply chain can benefit from AI infrastructure through several kinds of silicon. Management also described checking data-center construction and power availability when assessing demand. That is a sensible connection: an accelerator order ultimately depends on a system that can be packaged, installed, powered, cooled, and paid for. Wafer demand does not exist independently of those downstream constraints.
Capacity planning makes the time mismatch explicit. A fab investment takes time to become qualified output, while customer forecasts can change much faster. Waiting for certainty risks arriving after the market needs capacity. Building against every optimistic forecast risks underutilized equipment. Long-term relationships and detailed roadmaps improve information, but they cannot remove uncertainty about end demand. The economic skill is not simply spending the most; it is committing enough at the right points while retaining useful flexibility over tools, products, and process transitions.
Cash spending and accounting margin also move on different schedules. A capital purchase consumes cash when paid for, while its depreciation generally enters expenses over time as the asset is used. That means a profitable quarter does not by itself describe the current cash burden of expansion. Conversely, a heavy investment period need not imply that the existing operations are weak. Anyone trying to understand the business should read operating performance, capital expenditure, and utilization together. Compressing them into one growth percentage erases the industrial process that generates the financial result.
The quarter supports a fairly specific conclusion: demand for TSMC's advanced manufacturing remains strong in the reported period, and the next process ramp is already visible in the mix and cost structure. It does not settle the long-run return on every AI investment or tell us what a stock should be worth. The engineering and financial questions meet at useful output per invested dollar. More transistors are valuable when customers can turn them into products whose performance justifies the cost of making them.
For the next release, I will be comparing the new-node share with margin progression and the assumptions behind guidance. Revenue growth alone could reflect volume, pricing, mix, currency, or some combination. A clean explanation needs to preserve those possibilities until the disclosures distinguish them. This is one reason foundry earnings are worth reading as engineering documents: beneath the financial vocabulary are decisions about yield, tool productivity, product architecture, and the rate at which a manufacturing process becomes routine.

Construction robotics / materials
ICON scales a concrete printer, but the wall is only part of the house
ICON announced a $200 million Series D on October 13, co-led by Baillie Gifford and funds managed by BlackRock. The company tied the financing to manufacturing and deployment of its Titan construction-printing system, expanded research capacity in Austin, and growth into more US markets. It says it has passed 270 printed buildings and is on pace for fourfold revenue growth in 2026. That growth statement is a company projection for an unfinished year. The financing is real evidence of backing; it is not an independent audit of construction cost or productivity.
A construction printer has to handle a material that changes while the machine is using it. The mix must travel through the delivery system and nozzle without requiring impossible pressure, then hold its shape after deposition. Each new layer loads the material beneath it before that material has reached its final strength. The desired behavior is therefore contradictory only if time is ignored: flow during placement, resist deformation afterward. Rheology, setting behavior, temperature, and the motion program are coupled design variables, not separate details owned by unrelated teams.
Yield stress offers a useful way to think about that behavior. A material can resist small applied stresses yet flow when the imposed stress is large enough. Thixotropic behavior adds history dependence: structure can break down during shearing and rebuild at rest. Real printable cementitious mixtures are more complicated than either ideal model, but the models explain the operating window. A mixture that pumps beautifully may slump after extrusion. One that supports a tall fresh wall may be difficult to deliver consistently. Changing the material recipe can force changes in speed, layer height, and equipment.
Layer timing creates another tradeoff. Return too quickly and the lower layers may not support the accumulating load. Wait too long and the interface can become less favorable for bonding, depending on the material and conditions. A pause caused by a clogged nozzle is therefore not just lost machine time; it may change the properties of the wall. Toolpath planning has to account for curing behavior and interruption recovery. The construction sequence becomes part of the structural process, not merely a convenient way to draw the intended geometry.
Geometry itself is only one part of acceptance. A visually neat bead does not establish reinforcement continuity, moisture performance, fire resistance, or the behavior of connections to other building elements. Those depend on the designed assembly and its evidence. The printed wall must meet foundations, openings, roofs, utilities, and finishes, with tolerances that the following trades can use. A robot that places material accurately can still create expensive downstream work if it optimizes its own operation without considering how electricians, installers, and inspectors encounter the result.
The relevant economic comparison is consequently broader than printing speed. A project budget includes site preparation, equipment mobilization, material supply, labor around the machine, inspections, and the portions of the building that are not printed. Faster wall production can reduce the critical path, or it can merely create completed walls waiting for another constrained trade. The savings depend on the schedule and the baseline construction method. A percentage attached to a particular scope should not be applied to an entire home without checking what the scope includes.
There is a scale question for the business too. Selling or deploying more machines requires training, maintenance, spare parts, process support, and a reliable material supply. A central expert team can rescue a small number of difficult sites; a distributed installed base needs a repeatable service model. The machine's sensors should help identify whether a bad layer came from motion, material delivery, environmental conditions, or a recipe outside its allowed window. Otherwise every field problem becomes an expensive visit from the people who designed the system.
A useful production dataset would show total labor hours, interruptions, rework, material consumption, and time to the next trade across a range of sites. It should include projects that went poorly. Construction has enough local variation that one successful house cannot establish a universal cost curve. At the same time, demanding universal success before recognizing a useful process would be unreasonable. The right question is where the technology has a repeatable advantage, what conditions define that advantage, and whether the company can serve enough projects inside those conditions.
ICON's new capital can fund the unglamorous work that answers those questions. The printer is a striking object, but the product is a controlled construction process with people and materials around it. If Titan becomes more broadly deployable, the strongest evidence will be completed buildings and repeat customers with fewer surprises between design and handoff. Printing a wall is impressive. Making its cost, schedule, and quality predictable is what would turn that impression into a durable business.

The methane experiment is the standard I keep returning to: define the task, preserve the ground truth, and count the failures as carefully as the successes. The same habit would improve a navigation benchmark, a construction-productivity claim, or an interpretation of a semiconductor quarter. Different fields need different measurements, but they all benefit from knowing exactly what a number stands for.
This week did not need a single grand narrative. A better gyro, a more credible orbital measurement, a costly but productive manufacturing ramp, and a financed construction platform are enough. Each gives us a concrete next question, which is more useful than pretending each announcement has already answered the largest one.